
Query consoles
A console is a Monaco editor bound to one data source and one schema, with an IntelliJ toolbar above it and its own database session behind it. Consoles persist across restarts, can be renamed, and reopen from the console dropdown in the toolbar.
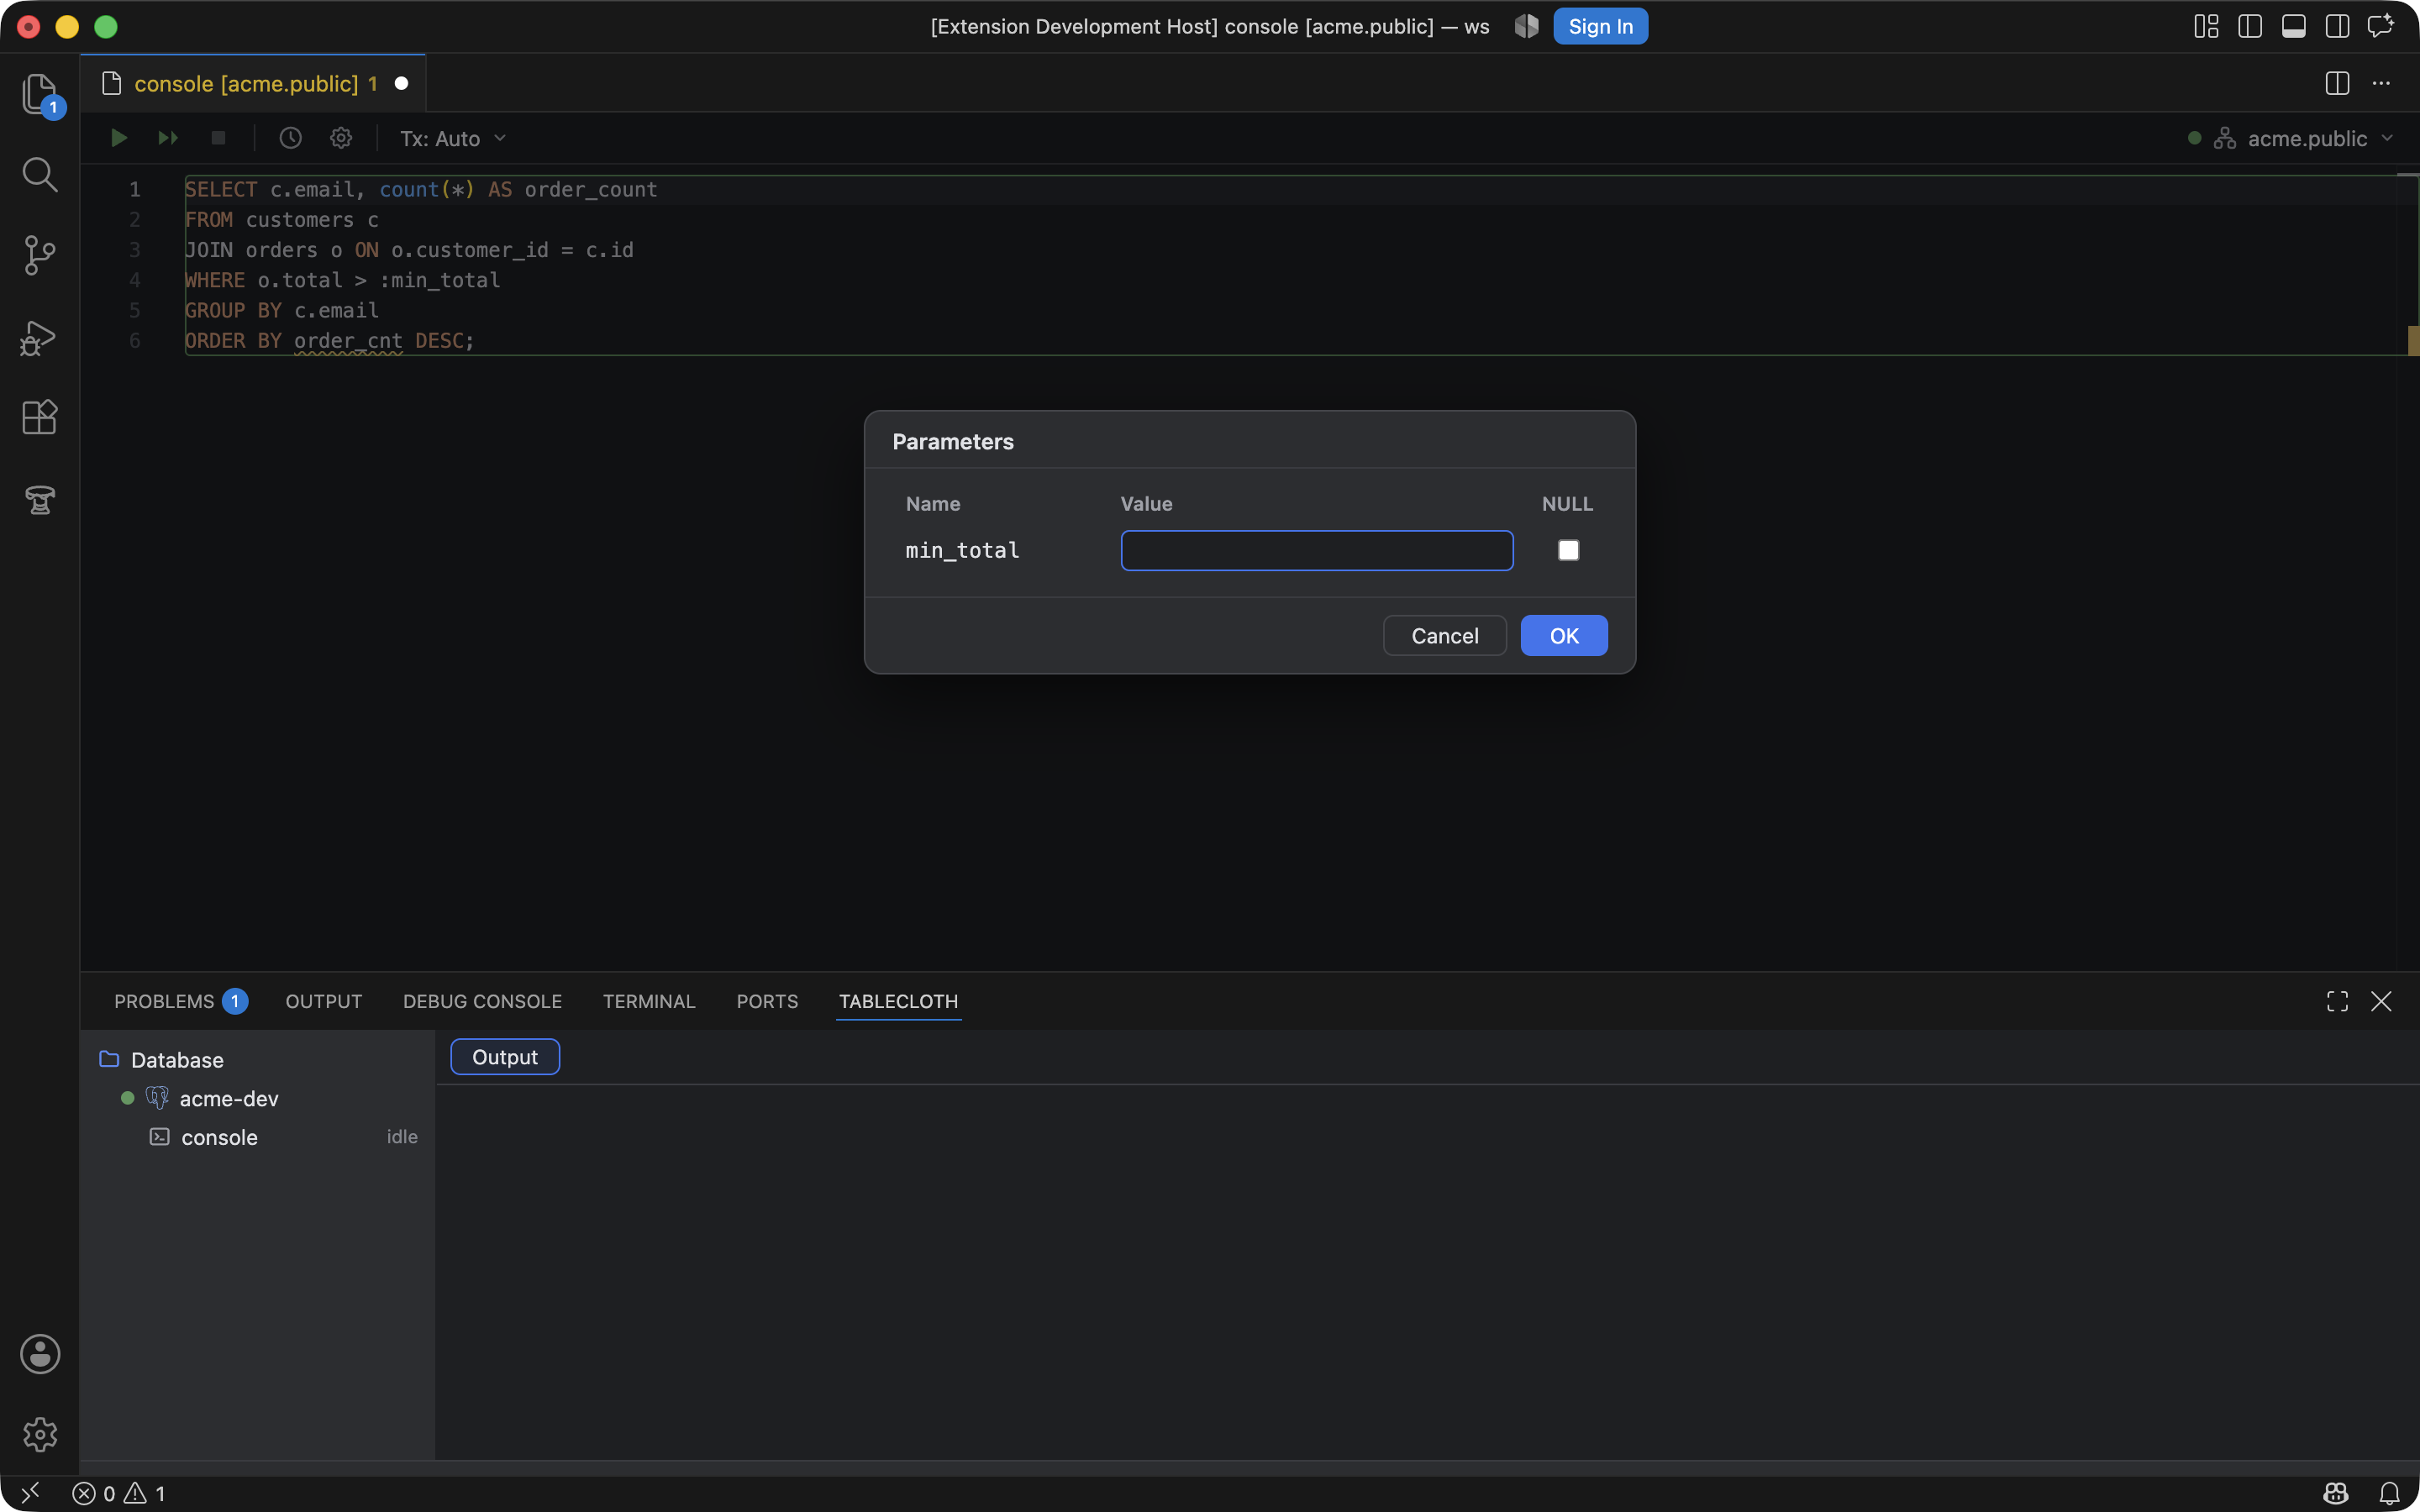
Inspections, a :min_total parameter, and the values dialog that asks for it on run.
Running SQL
- ⌘⏎ runs the selection if there is one, otherwise the statement at the caret. The green frame shows which statement that is.
- Run script (the toolbar button) runs the whole console. Multi-statement runs produce one result tab per query.
- ⌘F2 cancels the running statement by killing it server-side (
pg_cancel_backend,KILL QUERY). SQLite runs in-process and can't be cancelled. - Statements with parameters ask for values first.
:nameand${name}work everywhere;?works on MySQL and SQLite and$1on PostgreSQL. Values are remembered per data source. - A
DELETEorUPDATEwith noWHEREclause asks before it runs. The dialog names the table and how many rows it holds, counted on the console's own session so an open transaction's changes are included. Cancel is the default button, so a stray ⏎ after ⌘⏎ cancels; Run anyway runs it, and Don't ask again for this console silences it for that console.tablecloth.execution.warnWithoutWhereturns it off everywhere, and changing that setting resets every console's "Don't ask again" choice. Run File on Data Source asks through a native dialog with a third button, Run all anyway, that answers for the rest of that run.
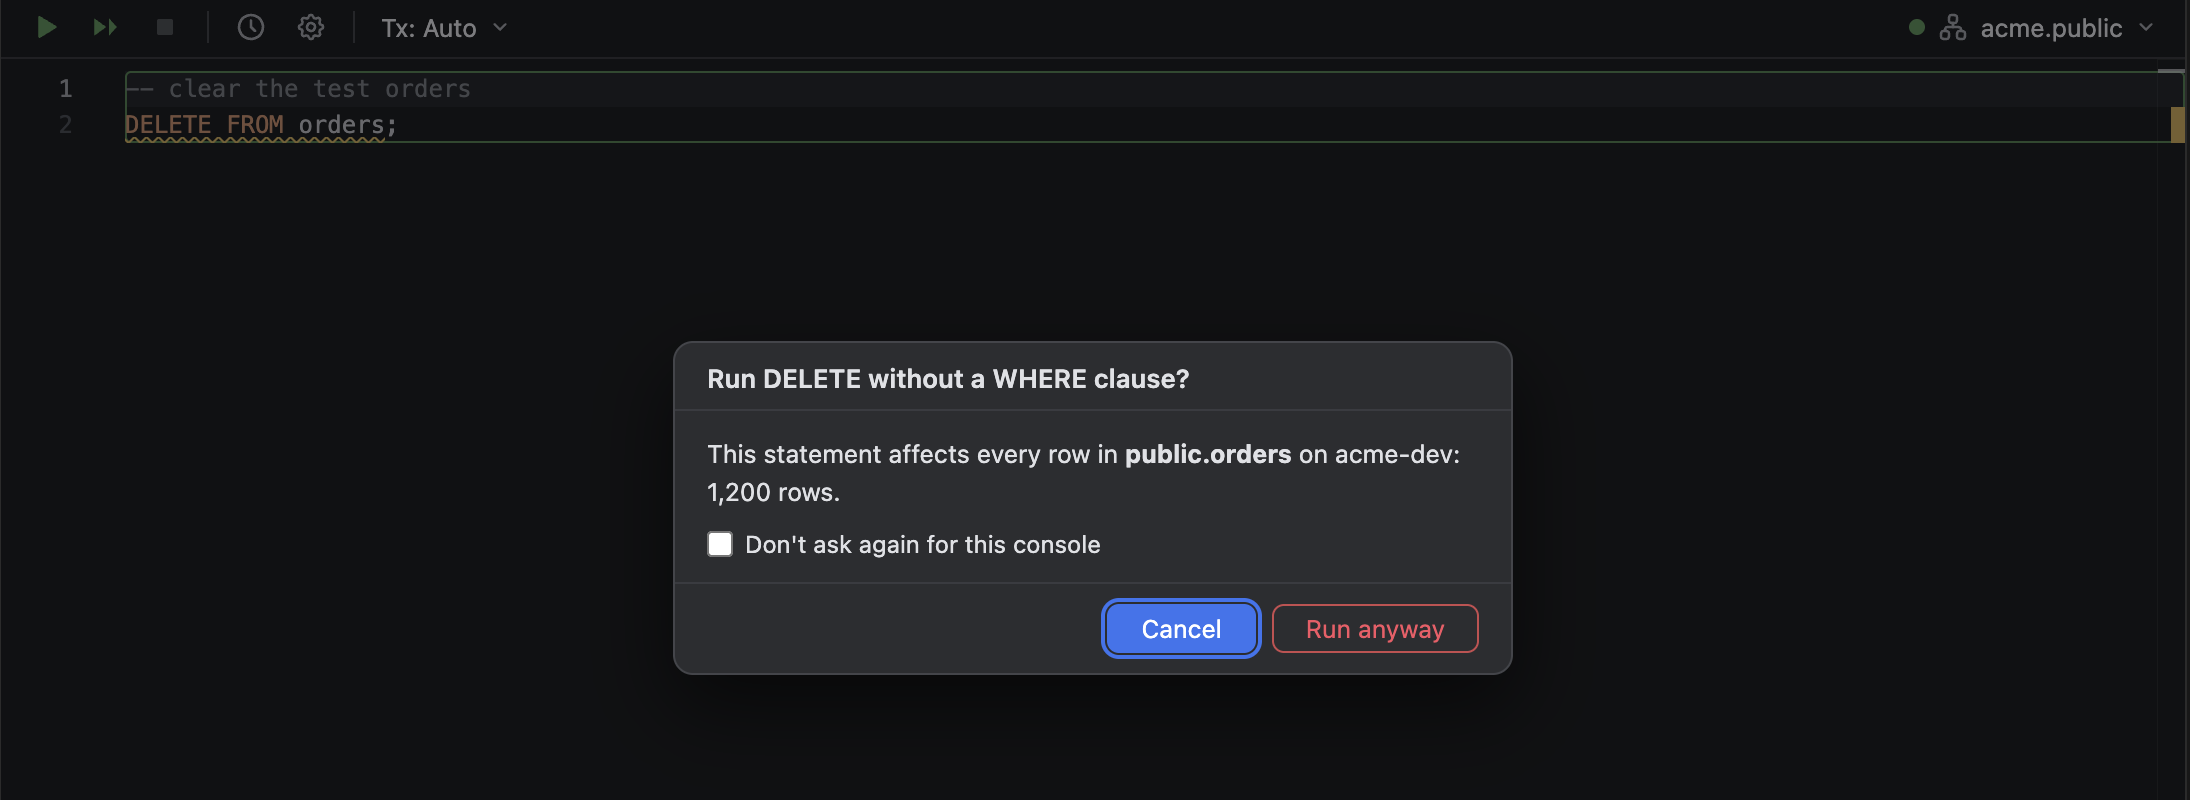
Cancel has focus; Run anyway needs a Tab or a click.
Explain Plan
Explain Plan asks the server for the plan of the statement at the caret and shows it in a Plan tab next to the results: a tree of operations with what each works on, its cost and its row estimate, or the same nodes as a table with every figure. Explain Analyse runs the statement and adds the actual rows and the time per node, with a heat bar so the node that lied stands out and the total and planning time on the right. Both live in the Explain dropdown on the toolbar and in the editor's context menu, and as commands for attached .sql files.
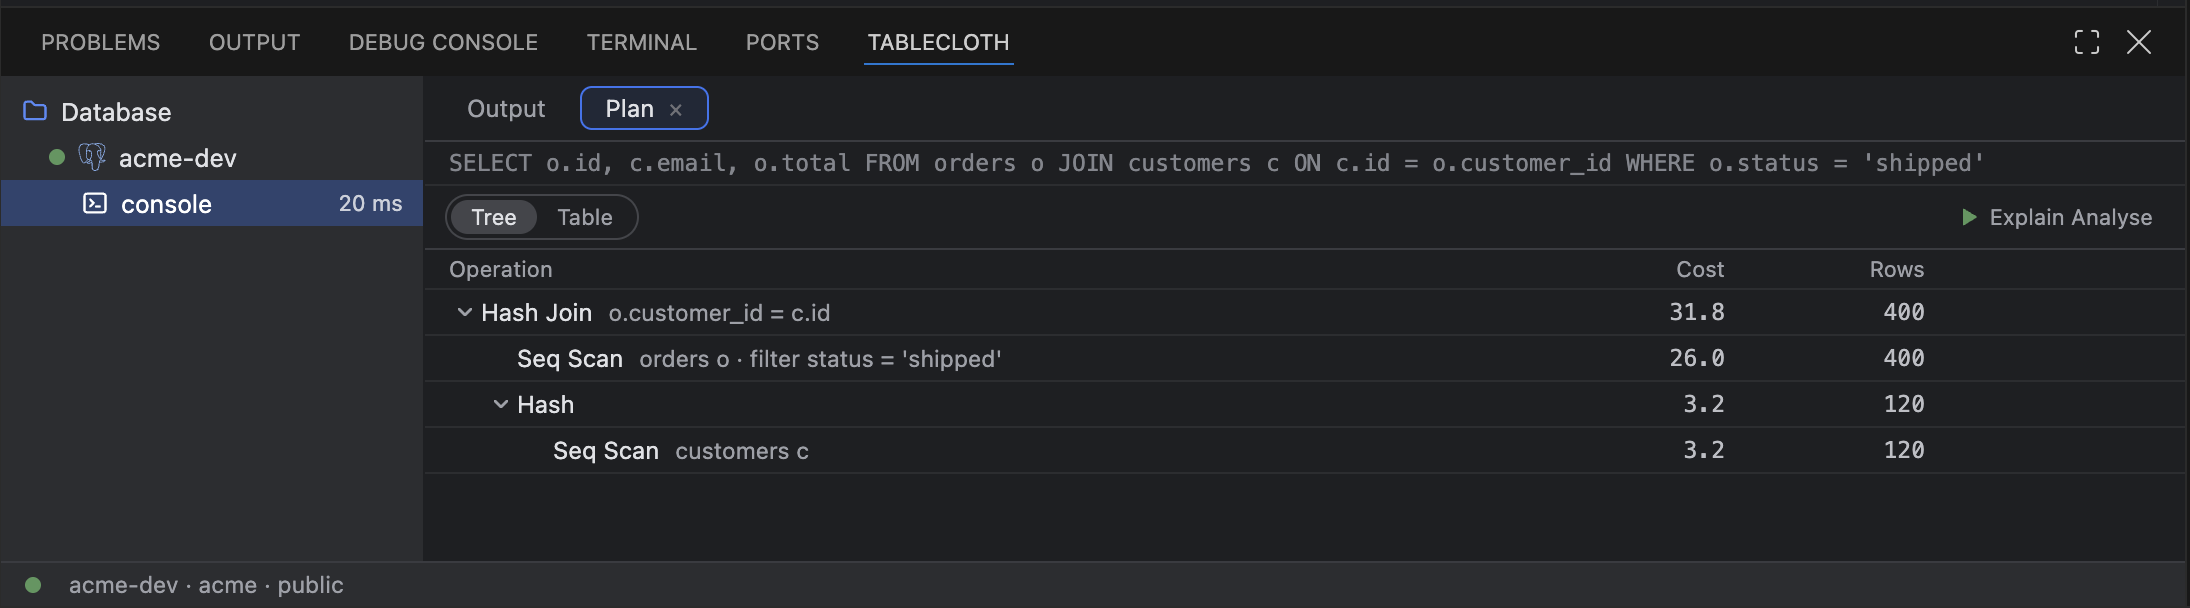
Explain Plan on a join: the operations as a tree, costs and row estimates, Explain Analyse a click away.
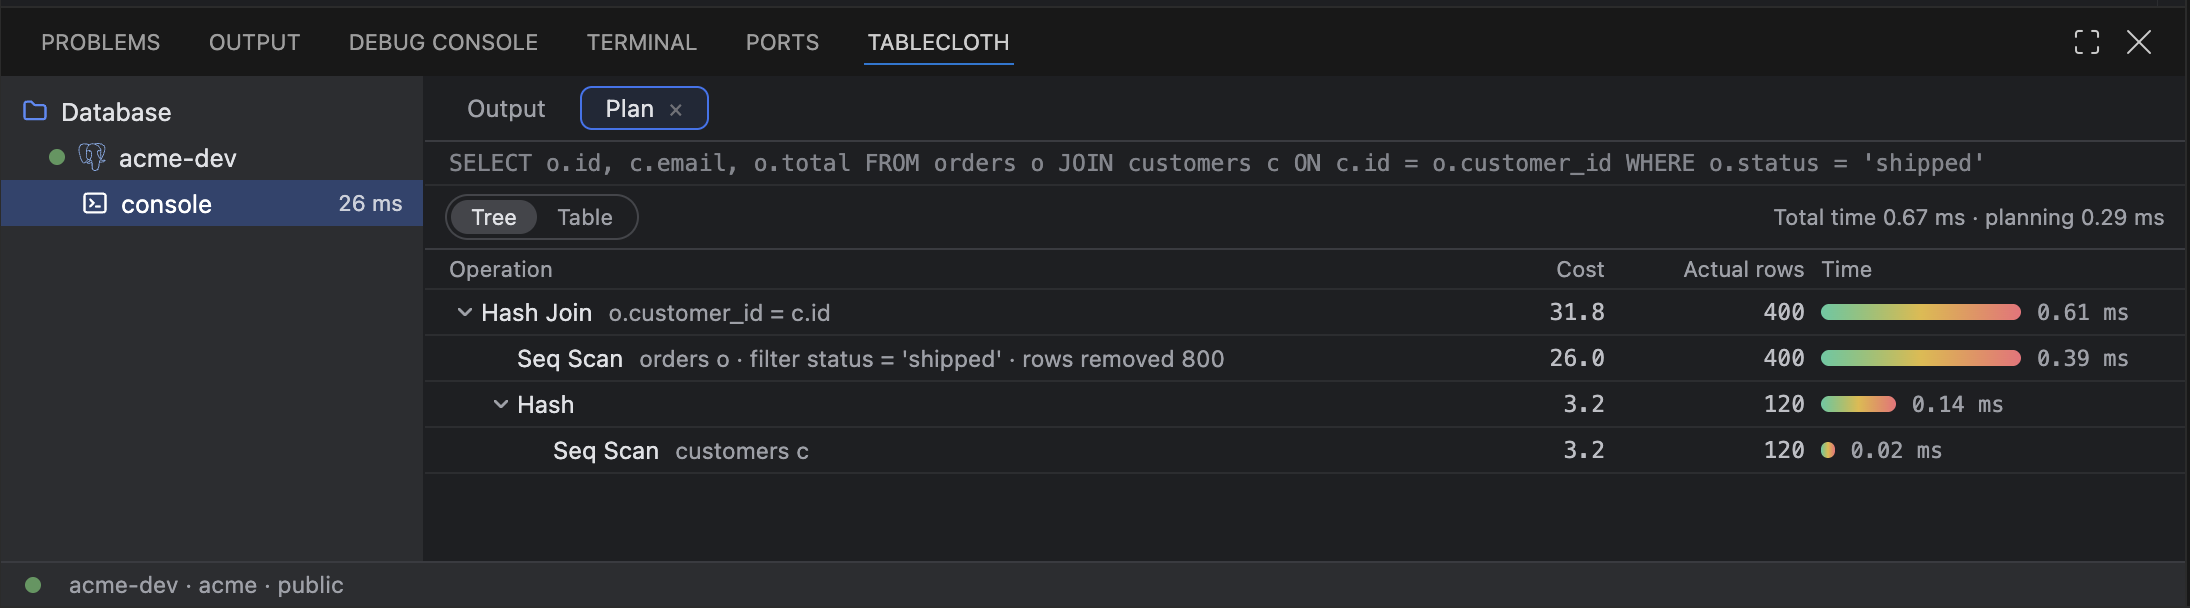
Explain Analyse: the real numbers, and rows removed by the filter.
An analyse is always rolled back (a savepoint inside an open transaction, a transaction of its own otherwise), so a DELETE or UPDATE can be analysed without losing data on a transactional engine. It still executes, so a statement without a WHERE clause asks first. SQLite has no analyse and shows the plan instead; MariaDB uses its ANALYZE.
Toolbar
Run statement, run script, cancel, the schema switcher, transaction mode, commit and roll back, query history, and data source properties. The schema switcher really switches: it sets search_path on PostgreSQL and runs USE on MySQL.
Transactions
Each console has a transaction mode, Auto or Manual, and an isolation level: default, read committed, repeatable read or serializable. In Manual, statements run inside one open transaction until you press Commit or Roll back. The isolation level is applied to the session that runs your statements and reapplied after a reconnect.
Results and output
The Tablecloth panel is shaped like IntelliJ's Services window: a tree of Database → source → console on the left, and for each console its result tabs and an Output log. Result tabs take their name from a leading comment in the statement or from the table it reads. Console result grids are the same grid as the data editor, and are editable when the statement is a single-table SELECT with the key columns in the result; otherwise they open read-only and say why. Selecting a data source node shows its Information tab and action row instead.
Each result tab has a close icon, shown on hover and on the active tab, and a right-click menu with Close, Close Other Tabs and Close All Tabs. A long name truncates before the icon.
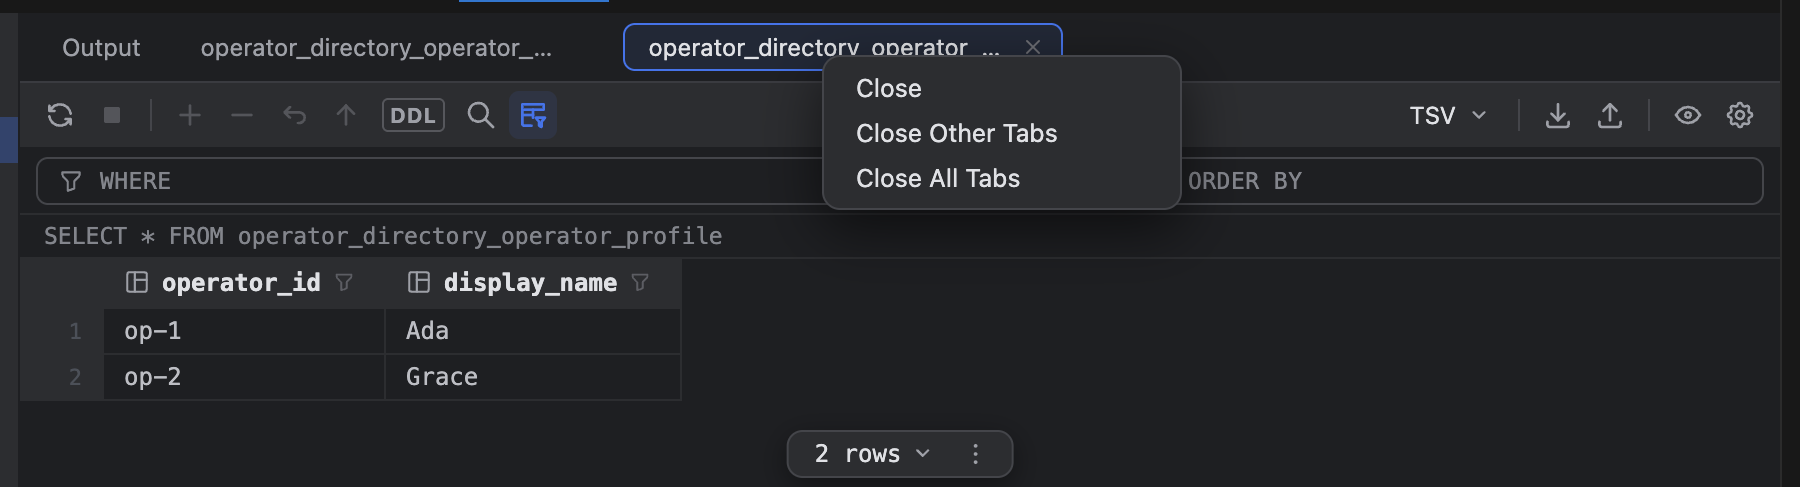
The result tab's right-click menu, and the close icon on the active tab.
Query history
Query History in the toolbar or the editor title menu lists what this console has run. Picking an entry inserts it at the caret.
Plain .sql files
You don't need a console for everything:
- Run File on Data Source… in the explorer context menu of any
.sqlfile runs it against a source you pick. - Attach File to Data Source… in the editor context menu binds an open
.sqlfile to a source. From then on ⌘⏎, Run File on Bound Data Source, ⌘F2, completion and inspections all work in that file as they would in a console.